Cumulative Discounted Net Returns: The cumulative net returns (returns − costs) per acre over 25 years for a healthy vineyard, an untreated infected vineyard, and infected vineyards where action is taken. Current and future dollar amounts are in 2013 dollars and are discounted to 2013 using a 3% discount rate.
Additional Cumulative Discounted Net Benefits (ACDNB): The difference in cumulative net returns (returns - costs) per acre over 25 years between an infected vineyard where action is taken and an untreated infected vineyard. Current and future dollar amounts are in 2013 dollars and are discounted to 2013 using a 3% discount rate.
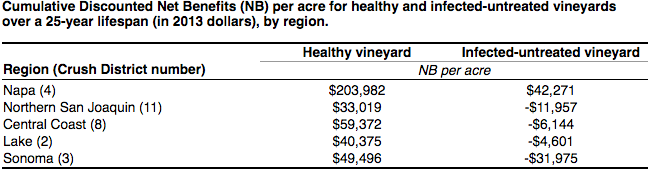
As a reference point, here are the discounted cumulative net benefits for a healthy and an untreated infected vineyard.
| Healthy vineyard | Infected-untreated vineyard | |
|---|---|---|
| Region (Crush District number) | NB per acre | |
| Napa (4) | $203,982 | $42,271 |
| Northern San Joaquin (11) | $33,019 | -$11,957 |
| Central Coast (8) | $59,372 | -$6,144 |
| Lake (2) | $40,375 | -$4,601 |
| Sonoma (3) | $49,496 | -$31,975 |
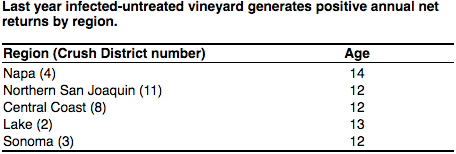
Last Profitable Year: The last year an infected vineyard generates positive annual net returns (returns - costs). This year is the same for discounted and nominal net returns.
As a reference point, here are the last years an untreated infected vineyard generates positive annual net returns.
| Region (Crush District number) | Age |
|---|---|
| Napa (4) | 14 |
| Northern San Joaquin (11) | 12 |
| Central Coast (8) | 12 |
| Lake (2) | 13 |
| Sonoma (3) | 12 |
Age Adoption Pays Off: The age when cumulative discounted net returns (returns – costs) for a treated infected vineyard exceed those from an untreated infected vineyard.
Infection Probability Threshold: The probability of infection where expected cumulative discounted net returns from treating a vineyard equals the expected cumulative discounted net returns from not treating a vineyard. If you perceive a probability of infection less than this probability, then not treating the vineyard generates greater cumulative discounted net returns than a treated vineyard, and vice versa.
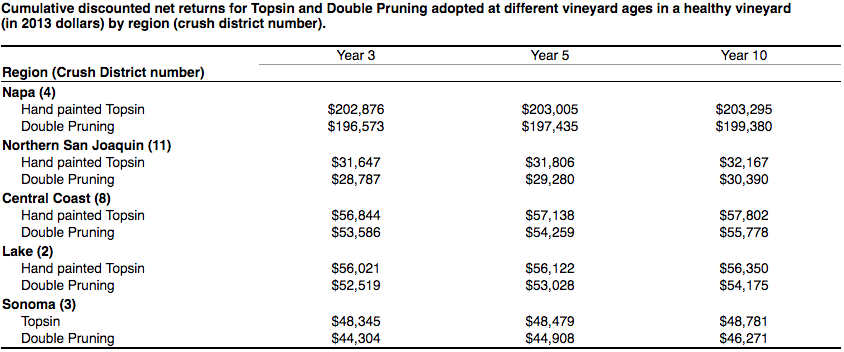
As a reference point here are the cumulative discounted net returns for a treated healthy vineyard.
| Year 3 | Year 5 | Year 10 | |
|---|---|---|---|
| Region (Crush District number) | |||
| Napa (4) | |||
| Hand painted Topsin | $202,876 | $203,005 | $203,295 |
| Double Pruning | $196,573 | $197,435 | $199,380 |
| Northern San Joaquin (11) | |||
| Hand painted Topsin | $31,647 | $31,806 | $32,167 |
| Double Pruning | $28,787 | $29,280 | $30,390 |
| Central Coast (8) | |||
| Hand painted Topsin | $56,844 | $57,138 | $57,802 |
| Double Pruning | $53,586 | $54,259 | $55,778 |
| Lake (2) | |||
| Hand painted Topsin | $56,021 | $56,122 | $56,350 |
| Double Pruning | $52,519 | $53,028 | $54,175 |
| Sonoma (3) | |||
| Topsin | $48,345 | $48,479 | $48,781 |
| Double Pruning | $44,304 | $44,908 | $46,271 |